Financial Highlights
Trends in Financial Results (consolidated)
Financial Highlights(Cash dividend)
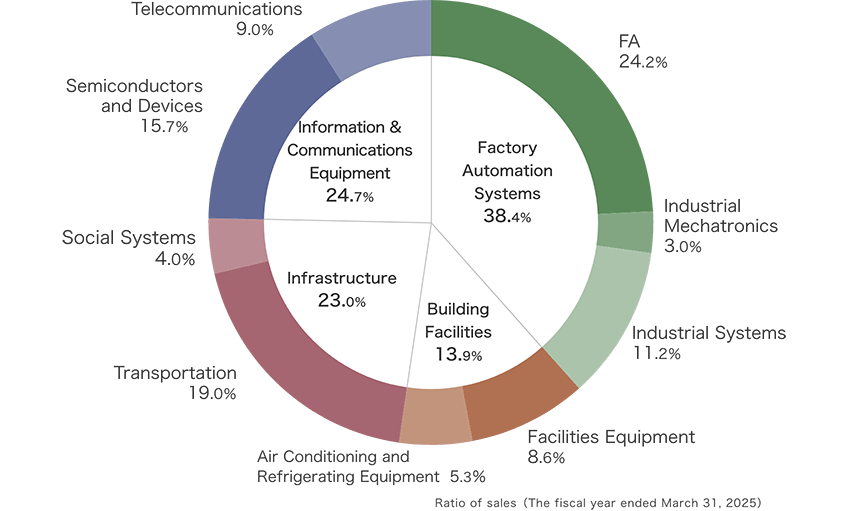
Net sales composition (for the fiscal year ended March 31, 2025)

-
Factory Automation Systems
-
Net Sales48,247 milllion yen
(Up 2.9% year on year) -
Ordinary Income2,281 milllion yen
(Down 18.9% year on year)
-
-
Building Facilities
-
Net Sales17,523 milllion yen
(Up 17.3% year on year) -
Ordinary Income318 milllion yen
(Up 42.7% year on year)
-
-
Infrastructure
-
Net Sales28,881 milllion yen
(Up 21.0% year on year) -
Ordinary Income186 milllion yen
(Up 67.9% year on year)
-
-
Information & Communications Equipment
-
Net Sales31,012 milllion yen
(Up 1.5% year on year) -
Ordinary Income1,897 milllion yen
(Up 16.7% year on year)
-

